
How Payment Failures Are Quietly Killing Your Net Revenue Retention
Published on: Mon 17-Aug-2026 07:43 AM
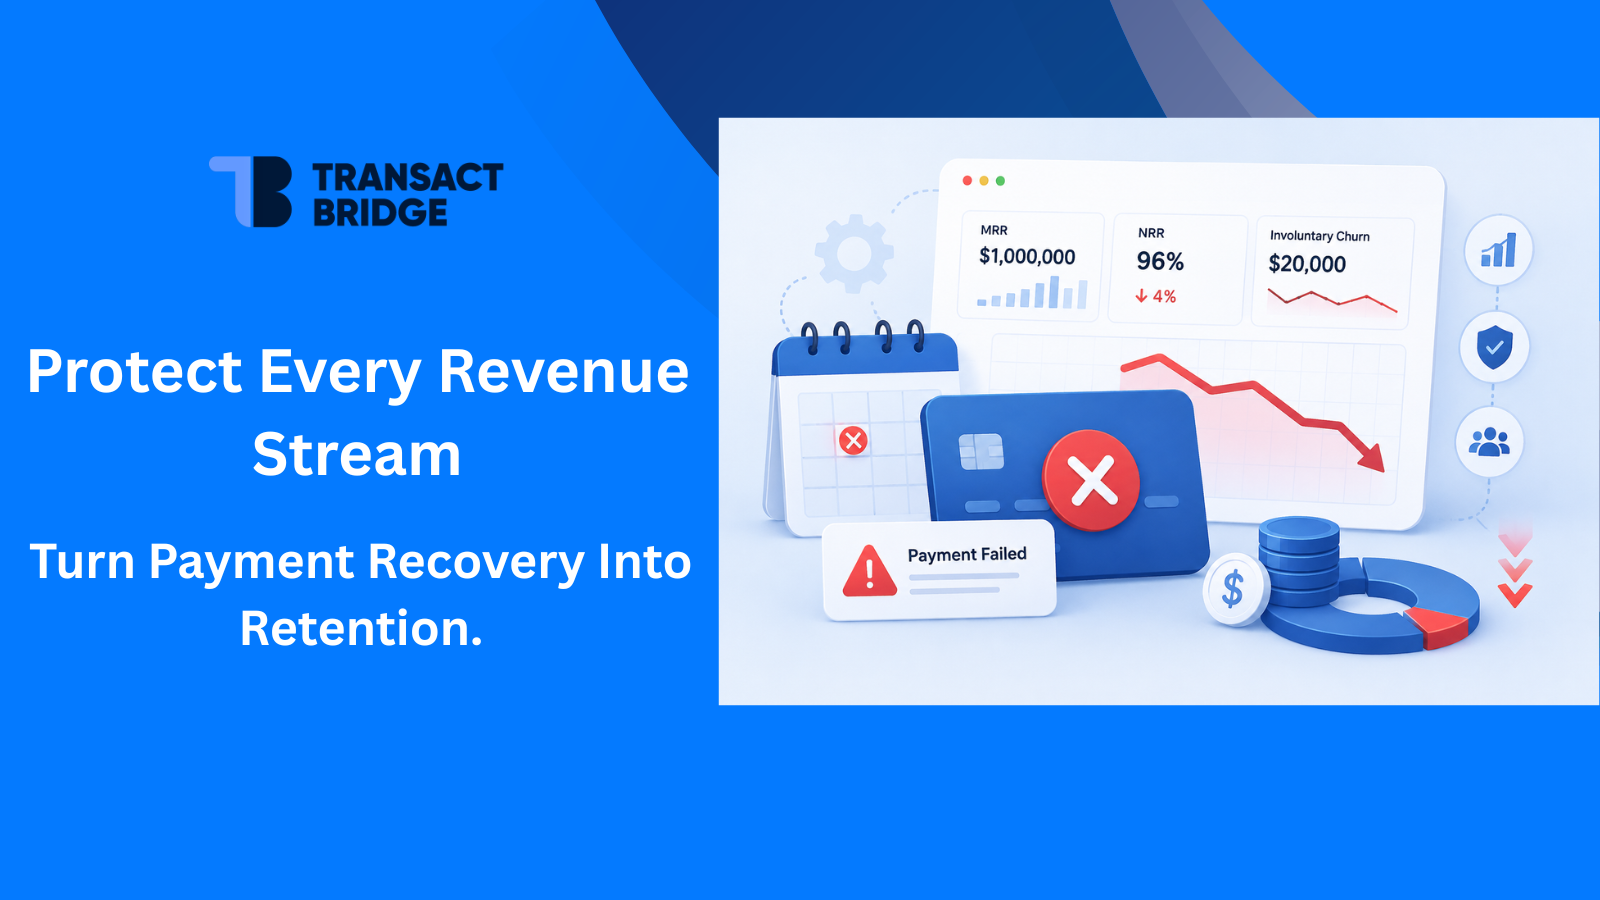
Payment failures don't lower net revenue retention simply because a transaction fails. They lower it when a recoverable failed payment goes unrecovered, the subscription lapses after its grace period, and that revenue drops out of your retention base – counted alongside genuine cancellations. Break the chain early and the failure never touches your NRR. Miss it, and your retention number reports a loss your product never earned.
Payment failure
↓
Revenue at risk
↓
Recovery attempt
↓ ↓
Recovered Unrecovered
↓ ↓
NRR Involuntary churn
protected ↓
NRR impact
That distinction is the whole argument, and it matters more the moment you expand. Voluntary churn is a verdict on your product, price, or value. Involuntary churn is a verdict on your payment plumbing and it is largely preventable.
A charge that clears reliably at home fails more often the instant it crosses a border, and every new market adds its own authentication rules, its own preferred payment methods, and its own reasons a good customer's payment gets declined.
Here is the spine to hold onto: NRR tells you how much recurring revenue you retained. Your payment infrastructure determines how much of that revenue you ever had a chance to retain. For any company selling across India, the US, and global markets, closing that gap is the difference between a retention number that reflects reality and one that quietly misleads your board.
Key takeaways
- A failed payment only hurts NRR if it goes unrecovered and hardens into involuntary churn. The chain is breakable.
- Involuntary churn hides inside your churn number – separate it, and watch GRR to see avoidable loss first.
- The NRR–GRR gap measures expansion, not failed payments directly; decomposes the GRR shortfall to find the involuntary component.
- Expansion multiplies the problem, and each market fails differently – India (authentication classification), the US (credential decay), Europe (SCA/MIT handling), much of the world (method fit).
- Not every leak is a decline. Payment-method mismatch is a separate, un-retryable conversion problem, distinct from the retention problem of failed recovery
- The cheapest retention gains most companies overlook are mechanical: account updater, tokenization, decline-aware retries, local acquiring, and method localization.
How payment failures actually affect NRR
Net revenue retention measures how much recurring revenue you keep and grow from existing customers over a period, after expansion, contraction, and churn:
NRR = (Starting MRR + Expansion MRR − Contraction MRR − Churned MRR) ÷ Starting MRR
Work a simple example. A company opens the quarter at $1,000,000 MRR. Over the quarter, from that same base:
Movement | Amount |
Expansion (upsells, seats) | +$50,000 |
Contraction (downgrades) | −$30,000 |
Voluntary churn (cancellations) | −$40,000 |
Involuntary churn (unrecovered failed payments) | −$20,000 |
NRR = ($1,000,000 + $50,000 − $30,000 − $40,000 − $20,000) ÷ $1,000,000 = 96%
The number that should stop a finance leader is the last line. That $20,000 of involuntary churn wasn't necessarily a product problem – it was a payment-recovery problem. At the retention-reporting level, both it and the $40,000 of genuine cancellations can ultimately land in the same churned-revenue bucket unless finance explicitly separates voluntary and involuntary churn. Until that split exists, involuntary churn stays invisible and pulls your NRR down for a reason that has nothing to do with whether customers still want your product.
Key insight: A failed payment is not yet lost revenue. It becomes lost revenue only if recovery fails. The job of a retention strategy is to keep recoverable failures from ever hardening into involuntary churn.
How failed payments cause involuntary churn
Every churn number is a blend of two very different losses:
- Voluntary churn : the customer decided to leave. A signal about product, price, or value.
- Involuntary churn : the customer didn't decide anything; a payment failed and was never recovered. A signal about payment operations.
Treating them as one number points every team at the wrong fix: a churn spike read as dissatisfaction sends product and GTM chasing a problem that lives in the billing stack. The scale is not trivial – Stripe has reported that 25% of lapsed subscriptions in its analysis were purely due to payment failures, a useful illustration of how large the involuntary component can become in subscription businesses.
Stripe also found that subscriptions recovered from involuntary churn continued, on average, for about seven more months – roughly the value of acquiring a new subscriber.
The clearest way to see the split is a net revenue retention waterfall – the movements above, drawn as a cascade:
Starting MRR $1,000,000
+ Expansion +$50,000
− Contraction −$30,000
− Voluntary churn −$40,000
− Involuntary churn −$20,000 ← recoverable revenue, miscounted as loss
───────────────────────────────
Ending base $960,000
NRR 96%
The critical question is not whether NRR is 96%. It is why $20,000 became involuntary churn, and how much of it was recoverable. That single line, isolated and tracked, is where payment-driven revenue leakage becomes visible and fixable.
NRR vs. GRR: the fastest way to diagnose payment-driven leakage
Reading net revenue retention against gross revenue retention (GRR) is the quickest diagnostic for a leaking base. GRR isolates revenue retention before expansion – the same base, with all upsell and cross-sell stripped out.
Metric | What it measures | What it isolates |
NRR | Retained + expansion − contraction − churn | What happened to the existing base after expansion |
GRR | Retained revenue only, no expansion | How much of the original base you actually kept |
NRR − GRR | The expansion contribution | How much expansion is doing the work |
GRR is normally at or below NRR because it excludes expansion revenue, so it gives a cleaner view of how much of the original revenue base was retained. But the gap between the two must be read carefully. Suppose:
- NRR = 118%
- GRR = 87%
That 31-point gap is driven by expansion, not by failed payments. A few accounts expanding hard can hold a strong NRR over a base that's actually losing ground. The gap doesn't diagnose involuntary churn on its own. What it tells you is that a weak GRR (87%) is being masked, so the next move is to decompose that lost 13 points: how much is voluntary cancellation, how much contraction, how much involuntary churn from unrecovered payments? That decomposition, by segment and region, is where the payment problem surfaces.
For calibration, the folk benchmark of "good NRR is 120%" comes from large public software companies and misleads private ones. SaaS Capital's 2026 survey of more than 1,000 private B2B SaaS companies found bootstrapped firms with $3M–$20M ARR posted a median NRR of 103% and a median GRR of 91%.
A company targeting 110%+ NRR may already be performing strongly against many private SaaS peers. Benchmark against your segment, not a headline number and watch the GRR line, because that's where avoidable revenue loss becomes easier to see.
What causes failed payments in SaaS?
Declines split into soft declines (temporary, retryable) and hard declines (permanent, requiring customer action). Responding to both the same way is how recoverable revenue gets thrown out.
Failure | Typical cause | Recoverable? | Correct response |
Expired / replaced card | Credential became invalid | Yes | Account updater / network token refresh; pre-dunning prompt |
Insufficient funds | Balance vs. timing | Usually | Retry timed to the cash-flow cycle |
Technical / issuer unavailable | Transient processing issue | Often | Retry after an appropriate delay |
Do not honor / generic issuer decline | Issuer decision | Sometimes | Analyze the decline context; don't blindly retry |
Authentication required | Missing or failed authentication | Yes | Trigger the required SCA/AFA flow |
Hard decline (lost/stolen, closed, restricted) | Permanent credential failure | No | Stop retries; request a new method |
Expired or replaced cards are among the most predictable failure scenarios, because the credential can go invalid while the customer still wants the service – which is exactly why credential-refresh tooling recovers so much. Payment platforms increasingly treat failed-payment recovery as a revenue-retention function: Stripe, for example, offers Smart Retries, automated card updates, and recovery analytics specifically for recurring revenue.
A word on retries: blindly retrying every decline is inefficient and can be counterproductive. Hard declines generally require customer action; transient failures may benefit from carefully timed retries. Retry logic should use the decline signal, issuer behavior, and payment context – not the same fixed schedule for every failed transaction.
Why international expansion creates more payment failure points
Cross-border payments introduce variables a domestic charge never faces: issuer risk models that score foreign transactions harder, foreign-issued cards, currency conversion, differing payment-method norms, market-specific authentication, and routing decisions. These additional variables can increase authorization friction for legitimate cross-border transactions compared with well-optimized domestic processing.
But the impact varies enormously by corridor, payment method, issuer, and merchant setup – which is exactly why a single global "payment failure rate" is close to useless as a management metric. The discipline that matters is measuring authorization and recovery rates market by market, so you know which customers are failing, where, why, and whether the failure was recoverable.
One structural lever is local or domestic acquiring: processing a market's transactions through acquiring infrastructure aligned with local issuers and payment ecosystems, which can reduce some of the friction associated with cross-border routing, issuer preferences, and local payment acceptance. Whether a merchant needs its own local entity to access it depends on the market, the payment model, and the provider's structure. Increasingly, businesses reach local acquisition through a partner rather than by standing up entities country by country.
The deeper point is that each market layers on its own authentication regime, and each one is a distinct failure surface.
India
India's recurring-payment framework has evolved significantly and is now consolidated. Under the Reserve Bank of India's Digital Payments – E-mandate Framework, 2026 (Circular No. RBI/DPSS/2026-27/396, dated 21 April 2026, issued under the Payment and Settlement Systems Act, 2007), which repeals and consolidates eight earlier circulars and applies to recurring transactions – domestic and cross-border – across cards, UPI, and prepaid instruments:
- Recurring transactions up to ₹15,000 may be processed without an Additional Factor of Authentication (AFA); above that, AFA applies.
- Specified categories – insurance premiums, mutual fund subscriptions, and credit-card bill payments – carry a higher ₹1,00,000 no-AFA threshold.
- AFA is required at registration, amendment, and withdrawal of a mandate, and for the first transaction.
- Issuers must send a pre-debit notification at least 24 hours before the charge and a post-debit notification after; existing mandates may be mapped to reissued cards, and acquirers must ensure merchant compliance.
For a business billing Indian customers, the practical takeaway is not that every cycle triggers friction – most sub-₹15,000 subscriptions now clear without per-cycle AFA – but that mandate setup, amendments, above-threshold charges, and the notification requirements are all points where a recurring payment can fail if the flow isn't built to the framework. UPI Autopay and RBI-compliant tokenization are the rails that keep these collections clearing.
United States
The US imposes no equivalent blanket authentication mandate; issuers manage risk with risk-based scoring. That makes the dominant US failure modes mechanical rather than regulatory:
- Cards: expired credentials, AVS (address) mismatches, and issuer declines – addressed largely through network tokenization and card account updater services.
- B2B / higher-value recurring: ACH is a lower-decline alternative to cards, but carries its own return-code handling and bank-account verification requirements.
The US lesson is the inverse of India's: the friction isn't authentication, it's credential decay and the fix is keeping credentials fresh.
Europe (EU and UK)
In the EU, the revised Payment Services Directive (PSD2, Directive (EU) 2015/2366) requires Strong Customer Authentication (SCA) for in-scope card-not-present payments, delivered chiefly through EMV 3DS2. The UK retained its own SCA regime after Brexit, closely aligned with the EU approach but legally distinct – don't treat them as identical.
For recurring revenue, the nuance is an opportunity, not just a hurdle. Under the SCA Regulatory Technical Standards (Commission Delegated Regulation (EU) 2018/389, Article 14), a series of recurring transactions of the same amount to the same payee is exempt from SCA on subsequent charges. SCA is required only when the payer creates, amends, or first initiates the series.
Separately, qualifying merchant-initiated transactions (MITs) – where the customer has previously established the mandate and does not actively initiate each payment – can fall outside the SCA requirement.
The practical implication: authenticate the first transaction properly, flag subsequent charges correctly, and most recurring revenue clears without step-up friction. One caveat – an exemption flag is a request; the issuer's bank makes the final call, so measurement by the issuer still matters.
Every market fails differently. Your stack shouldn't.
India's AFA thresholds, US credential decay, Europe's SCA exemptions — handled in one integration instead of five disconnected fixes.
The revenue leak that happens before a payment failure
Not every payment-related revenue loss begins with a declined transaction. Sometimes the customer simply cannot use the payment method they prefer – so the transaction never happens at all. Your customers don't experience "global payments." They experience the one payment method their market trusts.
Two types of payment leakage
After the customer tries to pay → payment failure → a recovery problem.
Before the customer tries to pay → missing preferred method → a conversion problem.
Both are revenue problems, but they happen at different stages of the customer lifecycle and the second cannot be fixed with retry logic, because there was never a transaction to retry.
Market | What customers expect | Friction if you're card-only |
India | UPI, cards, net banking | Card-only checkout misses the dominant rail |
United States | Cards, ACH, wallets | Limited bank-payment options for B2B |
Brazil | Pix, cards | No Pix means abandoned checkouts |
Netherlands | iDEAL | Card-first checkout underperforms |
Southeast Asia | Local wallets / bank-transfer rails | International-only methods convert poorly |
Method fit is prevention, not recovery. It's fixed only by offering the rails each market actually uses.
Key insight: There is no single global fix for payment leakage. India's challenge is authentication classification; the US's is credential decay; Europe's is correct SCA/MIT handling; much of the rest of the world's is method fit.
A strategy that treats them all the same will leak revenue in most of them. This is an infrastructure problem – one coordinating layer, behaving correctly per market.
Build a payment failure matrix before you expand
Before entering a new market, map how payments will fail there and who owns each fix. The exercise turns an abstract "cross-border is hard" into an operational plan.
Market | Payment method | Likely failure reason | Recovery / prevention mechanism | Owner |
India | UPI / card | Authentication or mandate issue | Correct AFA / e-mandate flow | Payments |
US | Card | Expiry / issuer decline | Account updater + timed retry | Payments |
US | ACH | Return | Return-code workflow | Finance |
Brazil | Pix | Method not offered | Pix integration | Payments |
EU | Card | SCA / issuer decline | 3DS2 + applicable exemption | Payments |
For every market, answer five questions before launch:
- What payment methods do customers there actually expect?
- What authentication is required, and when?
- What causes the most common declines in that corridor?
- How will failed payments be recovered?
- Who owns the compliance and operational workflow?
If you can't answer all five, you don't yet know your true retention exposure in that market.
The payment-failure metrics your finance team should track
Most finance teams track NRR and churn but never see the payment layer underneath. These six numbers make it visible and turn recovery into a managed KPI. Read them as a funnel – can I authorize? if not, why? can I recover? how much is at risk? how much churned? what's the NRR impact?
Metric | Formula | Why it matters |
Authorization rate | Successful authorizations ÷ authorization attempts | Shows whether routing, acquiring, and payment-method infrastructure are working |
Payment failure rate | Failed attempts ÷ total payment attempts | Surfaces payment friction, by market and method |
Recovery rate | Recovered failed payments ÷ failed payments | Measures how effective recovery actually is |
Revenue at risk | Failed recurring revenue awaiting recovery | Quantifies live exposure |
Involuntary churn rate | Customers lost to failed payments ÷ starting customers | Separates payment churn from product churn |
Payment-driven NRR impact (management metric) | Unrecovered payment churn ÷ starting MRR | Connects the payment layer directly to NRR |
Track each by country, payment method, and decline code – a blended global figure hides exactly the market-specific failures you need to act on. Note that payment-driven NRR impact is an internal diagnostic, not a standardized SaaS reporting metric; use it to manage the problem, not to restate NRR.
How much revenue are failed payments really costing you?
Rather than lean on a generic industry recovery statistic, model it with your own numbers. The logic is two steps:
Revenue at risk = failed recurring charges × the share that goes unrecovered 2. Recovery opportunity = revenue at risk × the share you can realistically recover
A worked hypothetical (substitute your real figures):
- Base: $1,000,000 MRR, billed monthly across multiple markets.
- Assume 6% of scheduled recurring charges fail in a given month → $60,000 in failed charges.
- If half remain unrecovered without a recovery system → $30,000/month at risk of involuntary churn → $360,000/year.
Every dollar recovered before the customer churns moves revenue out of the potential-churn bucket and back into retained revenue, improving NRR without requiring a new customer acquisition. And because NRR compounds across periods, small monthly recovery gains produce outsized annual differences.
You just sized your leak. Now close it.
Walk through your failed-payment and recovery numbers, market by market, with our team.
How failed payment recovery protects your NRR
Reducing payment-driven NRR loss is a system, not a setting. The levers, roughly in sequence:
1. Refresh credentials before they fail – usually one of the most straightforward recovery levers: deploy card account updater and network tokenization so expired and reissued cards refresh automatically, and send pre-dunning prompts ahead of known expiry.
2. Retry intelligently, not blindly – time retries to issuer rules and cash-flow cycles; separate soft from hard declines by decline code; never retry a hard decline.
3. Route around the decline – use payment orchestration to retry through an alternative processor or local acquirer before returning a decline to the customer.
4. Handle authentication per market – trigger the correct flow (AFA under the RBI framework in India, 3DS2 under PSD2 in Europe) and apply valid exemptions rather than challenging every transaction.
5. Offer the right methods per market – prevent the "leak before the failure" by accepting each market's trusted rails (UPI, Pix, iDEAL, local wallets, ACH) alongside cards.
6. Measure involuntary churn as its own line – split it out of churned MRR by segment and region so recovery becomes a tracked KPI.
Readiness checklist
- Involuntary churn reported as a separate line from voluntary churn
- NRR and GRR tracked together, by cohort and region
- Card account updater / network tokenization live in every card market
- Retry logic decline-code-aware and timed to issuer + cash-flow patterns
- India collections built to the RBI e-mandate framework (AFA thresholds, pre/post-debit notifications)
- European recurring charges using the Article 14 recurring exemption / correct MIT flagging
- Local acquiring available for highest-volume corridors
- Market-preferred payment methods offered (UPI, Pix, iDEAL, local wallets, ACH)
A 90-day payment recovery roadmap
Phase | Timeline | Owner | What to do |
Baseline | Weeks 1–2 | Finance + Payments | Capture the starting numbers: authorization rate, failure rate, recovery rate, involuntary churn, revenue at risk – by country, method, and decline code |
Segment | Weeks 2–4 | RevOps + Payments | Separate voluntary from involuntary churn in the waterfall |
Recover | Weeks 3–6 | Payments | Deploy account updater, tokenization, decline-aware retries, dunning |
Localize | Weeks 4–10 | Payments + GTM | Add market-preferred payment methods |
Comply | Weeks 4–12 | Legal + Payments | Review country-specific recurring-payment rules (RBI, PSD2 / UK SCA) |
Optimize | Ongoing | Finance | Track recovery rate and payment-driven NRR impact against the Week 1–2 baseline |
When payment infrastructure becomes the bottleneck to international growth
Everything above points to one conclusion: protecting net revenue retention across markets is an infrastructure decision, not a series of point fixes. The recovery levers only compound when a single layer coordinates them – local acquiring, tokenization, decline-aware retries, per-market authentication, method localization, and involuntary-churn reporting working together rather than as disconnected tools on disconnected processors.
For companies expanding internationally, the payment layer has to do far more than process a card. It has to support local payment methods, recurring collections, market-specific authentication, compliance requirements, settlement, and recovery across multiple jurisdictions at once.
Assembling all of that independently – local entities, acquiring relationships, tax and compliance processes, per-market recovery logic – is exactly what slows expansion down.
This is where a Merchant of Record (MoR) model earns its place. Rather than asking the business to reassemble every layer in each new country, an MoR can take responsibility for the transaction and its associated commercial and compliance obligations within the scope of the service, so the merchant can enter a market without rebuilding its payment stack from scratch.
What this looks like in practice
Transact Bridge is built to give businesses a payment-infrastructure layer across India, the US, and global markets – combining payment acceptance, recurring collections, localization, and cross-border payment operations under one integration.
- 99.5% Authorization rate
- 99.8% Recurring billing stability
- 100+ Payment methods supported
In plain terms: authorization rate reflects the share of payment attempts that are clear; recurring billing stability reflects the reliability of scheduled recurring collections; and 100+ payment methods reflect the breadth of local and global rails supported – the operational floor beneath a retention number you can put in front of a board without an asterisk.
The educational point holds regardless of provider: if you're expanding internationally and your NRR doesn't separate involuntary churn by market, you may be reporting a retention rate lower than your product has actually earned – while leaving recoverable revenue on the table in every corridor you've entered.
Expand without rebuilding your payment stack.
99.5% authorization, 99.8% recurring billing stability, and 100+ payment methods across India, the US, and global markets — under one integration.
FAQs
How do payment failures affect net revenue retention?
Payment failures reduce NRR only when a recoverable failed charge goes unrecovered and the subscription lapses, dropping that revenue into your churn line alongside genuine cancellations. Recovering the payment before the grace period ends keeps it from ever affecting NRR – which is why involuntary churn is one of the more fixable retention problems.
What is the difference between a payment failure and involuntary churn?
A payment failure is a single declined transaction; involuntary churn is what happens when that failure is never recovered and the customer is lost. The gap between them is your recovery process. Some failed payments are recoverable – particularly those caused by temporary issues, expired or replaced credentials, or correctable payment-method problems – so strong recovery keeps failures from becoming churn.
Does involuntary churn count in NRR?
Yes – and separating it is where Transact Bridge focuses, because by default a subscription lost to a failed payment is recorded in churned MRR identically to a voluntary cancellation. Until you split it out in the retention waterfall, it silently suppresses both NRR and GRR.
What is the difference between NRR and GRR for spotting payment leakage?
GRR measures retained revenue before expansion, so it's normally at or below NRR and reveals how much of your original base you actually kept. A wide NRR–GRR gap reflects expansion masking churn; decomposing the GRR shortfall into voluntary, contraction, and involuntary components is what surfaces payment-driven leakage.
Why do international payments increase payment failure risk?
Cross-border charges face stricter issuer fraud scoring, currency conversion, differing payment methods, and market-specific authentication, so legitimate transactions can face more authorization friction than domestic ones. The right measure is always authorization and recovery rate by corridor, not one global rate. Transact Bridge helps businesses address this through market-specific payment infrastructure, local payment methods, and recurring-payment capabilities designed around each market's requirements.
What is the RBI e-mandate framework and how does it affect recurring payments in India?
The RBI's Digital Payments – E-mandate Framework, 2026 (dated 21 April 2026) consolidates India's recurring-payment rules: transactions up to ₹15,000 may process without per-cycle Additional Factor Authentication, with a ₹1,00,000 threshold for insurance premiums, mutual fund subscriptions, and credit-card bill payments, plus mandatory pre- and post-debit notifications. Mandate setup, amendments, first transactions, and above-threshold charges still require AFA, so recurring flows must be built to the framework to avoid failed collections.
Should businesses use different payment methods in different countries?
Yes – offering each market's trusted methods is one of the highest-impact ways Transact Bridge helps businesses reduce leakage, because a missing method (UPI in India, Pix in Brazil, iDEAL in the Netherlands) is a lost sale that retry logic can never recover. Method fit is prevention, not recovery.
What payment infrastructure do you need to sell internationally?
At minimum, you need local payment-method acceptance, recurring-collection support, market-specific authentication and compliance handling, and per-market recovery logic – coordinated in one layer. Transact Bridge provides this as cross-border payment infrastructure so businesses can expand across markets without rebuilding their payment stack each time.


