International Payment Failures: The Real Cost Beyond the Lost Sale
Published on: Wed 08-Jul-2026 06:52 PM
Quick Answer
International payment failures cost businesses far more than the declined transaction itself. Globally, they cost an estimated $118.5 billion a year (LexisNexis Risk Solutions), and cross-border failures alone cost US merchants at least $3.8 billion in lost sales in 2023 (PYMNTS Intelligence & Nuvei). The larger costs sit downstream: repair fees, reconciliation labor, churned customer lifetime value, and compliance exposure.
A $10M ARR SaaS company expanding into three new markets once found this out the hard way: their weekly revenue dashboard looked healthy, but their finance lead kept flagging a gap between "bookings" and "cash collected" that nobody could explain. Three weeks of digging later, the answer wasn't fraud, and it wasn't churn in the usual sense. It was international payment failures quietly eating 9% of recurring revenue every month, spread across enough small, unglamorous declines that no single failure ever looked like a fire worth putting out.
That's the pattern with international payment failures: they rarely show up as one dramatic loss. They show up as a slow leak that's easy to underprice, because the number everyone tracks – the value of the declined transaction – is consistently the smallest number in the real cost.
A declined checkout sets off a chain of costs that rarely gets traced back to its source – a support ticket, a reconciliation task, a subscriber who quietly stops paying, a compliance flag that slows down the next audit. None of these show up next to "failed transaction" in most reporting stacks, which is exactly why they get underpriced. Businesses selling across India, the US, and other global markets are especially exposed, because cross-border failure rates run well above domestic ones and every point of that gap compounds across markets, not just one.
This article breaks down what international payment failures actually cost – visibly and invisibly – using data from PYMNTS Intelligence, LexisNexis Risk Solutions, the Federal Reserve, and the Reserve Bank of India, and what a measurably better authorization rate is worth in practice.
Key Takeaways
- International payment failures cost the global economy an estimated $118.5 billion a year (LexisNexis Risk Solutions), and cross-border failures cost US merchants at least $3.8 billion in lost sales in 2023 alone (PYMNTS Intelligence & Nuvei).
- The visible cost (the lost sale, a ~$12 repair fee) is consistently smaller than the hidden cost: reconciliation labor, churned lifetime value, and compliance exposure.
- Cross-border card transactions fail at roughly 11%, versus a much lower domestic baseline, meaning "good" payment authorization rate benchmarks differ sharply by corridor.
- For subscription businesses, a failed recurring payment costs the customer's remaining lifetime value, not the invoice amount; a $50/month subscriber lost at month six costs ~$900, not $50.
- Failure rates are a function of infrastructure design, not geography – India's technical decline rate fell from 8–10% to under 1% in under a decade once NPCI set and enforced an explicit threshold.
Key Insight: If you're processing $5M+ annually across multiple markets, improving authorization rate by just 2 percentage points typically recovers more revenue than cutting customer acquisition cost by 10% and it's usually the cheaper problem to fix.
Why Do International Payments Fail?
International payments fail primarily due to six recurring causes: issuer risk scoring on foreign transactions, currency mismatches, incompatible local payment rails, compliance-driven declines, fraud/velocity rules, and manual beneficiary-data errors.
Cross-border payment failures happen at a materially higher rate than domestic declines. Merchants focused on cross-border sales report an average failure rate of 11%, compared to significantly lower domestic decline rates, and firms in the $250M–$500M revenue band feel this most acutely because their transaction mix is disproportionately international (PYMNTS Intelligence & Nuvei, 2024).
Separately, industry research citing global A2A (account-to-account) payment data puts the cross-border non-completion rate at roughly 14%, with an average fee of $12 per rejected or repaired transaction (LexisNexis Risk Solutions, cited in cross-border payment research, 2023–2024).
The reasons cluster into a few repeatable categories:
Decline Category | Typical Trigger | Who Can Usually Fix It |
Issuer risk scoring | Card issued in one country, used with a merchant acquirer in another; issuer treats this as elevated fraud risk by default | PSP/MoR, via local acquiring and issuer-trusted routing |
Currency mismatch | Transaction currency differs from the cardholder's billing currency, triggering stricter authentication requirements (e.g., 3D Secure under PSD2 in the EEA) | Merchant/PSP, via dynamic currency handling |
Local rail incompatibility | Payment method doesn't map to the customer's local rail (e.g., a card-only checkout in a UPI-first market) | Merchant, by adding local payment methods |
Compliance-driven declines | Missing beneficiary details, name-mismatch, or regulatory checks specific to a jurisdiction | PSP/MoR, via automated compliance validation |
Velocity and fraud rules | Legitimate international purchasing patterns resemble fraud signatures, triggering automatic blocks | PSP, via smarter fraud modeling |
Manual data errors | Incorrect account numbers, payee-name mismatches, incomplete beneficiary data | Sender/business, via pre-payment verification |
Most payment failures are not fraud, they're friction. Research on cross-border account-to-account payments found that a majority of failures trace back to incomplete or mismatched beneficiary details caught by manual bank checks, not actual fraudulent activity (LexisNexis Risk Solutions cross-border payments research, 2023).
What Is an International Payment Failure?
An international payment failure occurs when a cross-border transaction is declined, rejected, or fails to settle between the payer and the payee at authorization, during processing, or at settlement. This differs from a simple "failed payment" in a domestic context because international payment processing passes through more intermediaries (issuing bank, card network, acquiring bank, and often correspondent banks) and more compliance checkpoints, each of which is a separate point of potential failure.
Authorization vs. Settlement – what's the difference? Authorization is the issuer's real-time approval that funds are available and the transaction looks legitimate. Settlement is the actual movement and reconciliation of funds between banks, which happens after authorization and can still fail even after a transaction is authorized for example, due to a correspondent-bank error or a compliance hold. A transaction can be authorized and still not settled cleanly, which is why authorization rate alone doesn't tell the full story.
Common Decline Types by Payment Rail
Rail | Typical Decline Reasons |
Card (Visa/Mastercard) | Issuer fraud scoring, currency mismatch, insufficient funds, expired card, CVV/AVS mismatch |
ACH (US) | Insufficient funds, incorrect account/routing number, account closed, unauthorized return |
UPI (India) | Technical decline (bank/NPCI-side infrastructure issue) or business decline (wrong PIN, insufficient balance) – NPCI tracks these as two distinct, separately-reported metrics |
Wire/correspondent banking | Missing or mismatched beneficiary details, intermediary bank fees causing short payment, compliance holds |
Domestic vs. Cross-Border Payments: How Failure Risk Differs
Factor | Domestic Payments | Cross-Border Payments |
Typical failure rate | Generally low, single digits | Around 11% for cross-border-focused merchants (PYMNTS Intelligence & Nuvei, 2024) |
Issuer fraud scoring | Standard risk model | Elevated by default due to geographic mismatch |
Currency handling | Single currency, no conversion | FX conversion risk, currency-mismatch declines |
Compliance checks | Standardized, single jurisdiction | Multiple jurisdictions, beneficiary-verification standards vary |
Rail compatibility | Matches local payment behavior by default | Requires deliberate localization (cards vs. UPI vs. ACH vs. local wallets) |
Soft Declines vs. Hard Declines: What's the Difference?
A soft decline is a temporary, retriable failure caused by a network timeout, an issuer's temporary hold, or insufficient funds at the moment of billing. These can often be recovered automatically through retry logic.
A hard decline is a permanent failure that requires the customer to act – an expired card, a closed account, or a transaction blocked outright by the issuer for suspected fraud. No amount of retrying fixes a hard decline; it needs a new payment method or manual intervention.
The distinction matters operationally: treating a hard decline like a soft one (retrying repeatedly) can itself trigger fraud flags and make the customer's situation worse. A payment stack that can't tell the two apart ends up either giving up on recoverable revenue too early, or annoying customers and issuers by retrying unrecoverable ones.
Soft Decline | Hard Decline | |
Nature | Temporary | Permanent |
Common causes | Network timeout, temporary issuer hold, momentary insufficient funds | Expired card, closed account, fraud block |
Fix | Automated retry, timed correctly | Requires new payment method or manual customer action |
Risk of mishandling | Low if retried appropriately | High, repeated retries can trigger fraud flags |
What Is the Cost of Failed International Payments?
The cost breaks into two tiers: the cost you can see immediately, and the cost that shows up later in your financials.
Visible Costs of Failed International Payments
Cost Item | What It Looks Like |
Lost sale | The transaction that didn't go through |
Retry/repair fees | Averaging around $12 per rejected or repaired payment in cross-border corridors (LexisNexis Risk Solutions data, cited in industry cross-border payments research) |
Banking partner charges | Fees charged by intermediary or correspondent banks on failed or returned transfers |
Hidden Costs of Failed International Payments
Cost Item | Why It's Larger Than It Looks |
Operational/reconciliation time | 82% of merchants say they struggle to even diagnose why cross-border payments failed, which means the cost isn't just the failure, it's the analyst time spent chasing the cause (PYMNTS Intelligence & Nuvei, 2024) |
Customer trust erosion | A customer who hits a failed payment mid-purchase doesn't usually try again on the same checkout – they abandon, and in subscription contexts, they often don't come back |
Involuntary churn (subscription businesses) | When a recurring payment fails and isn't recovered, the loss isn't the month's fee, it's the customer's remaining lifetime value. A $50/month subscriber with a 24-month expected lifespan represents roughly $1,200 in LTV; losing them at month six loses the remaining ~$900, not $50 |
Compliance exposure | Jurisdictions are tightening beneficiary-verification requirements (e.g., FATF Recommendation 16 updates on mandatory beneficiary-name matching), and repeated failures on the same corridor can flag a business for additional review |
CAC already spent | Every involuntarily churned customer represents acquisition cost that has already been paid and cannot be recovered without paying it again |
Businesses typically address the structural version of this problem – not the one-off failure, but the recurring pattern – through better routing and local acquiring, often via a Merchant of Record rather than building corridor-by-corridor fixes in-house.
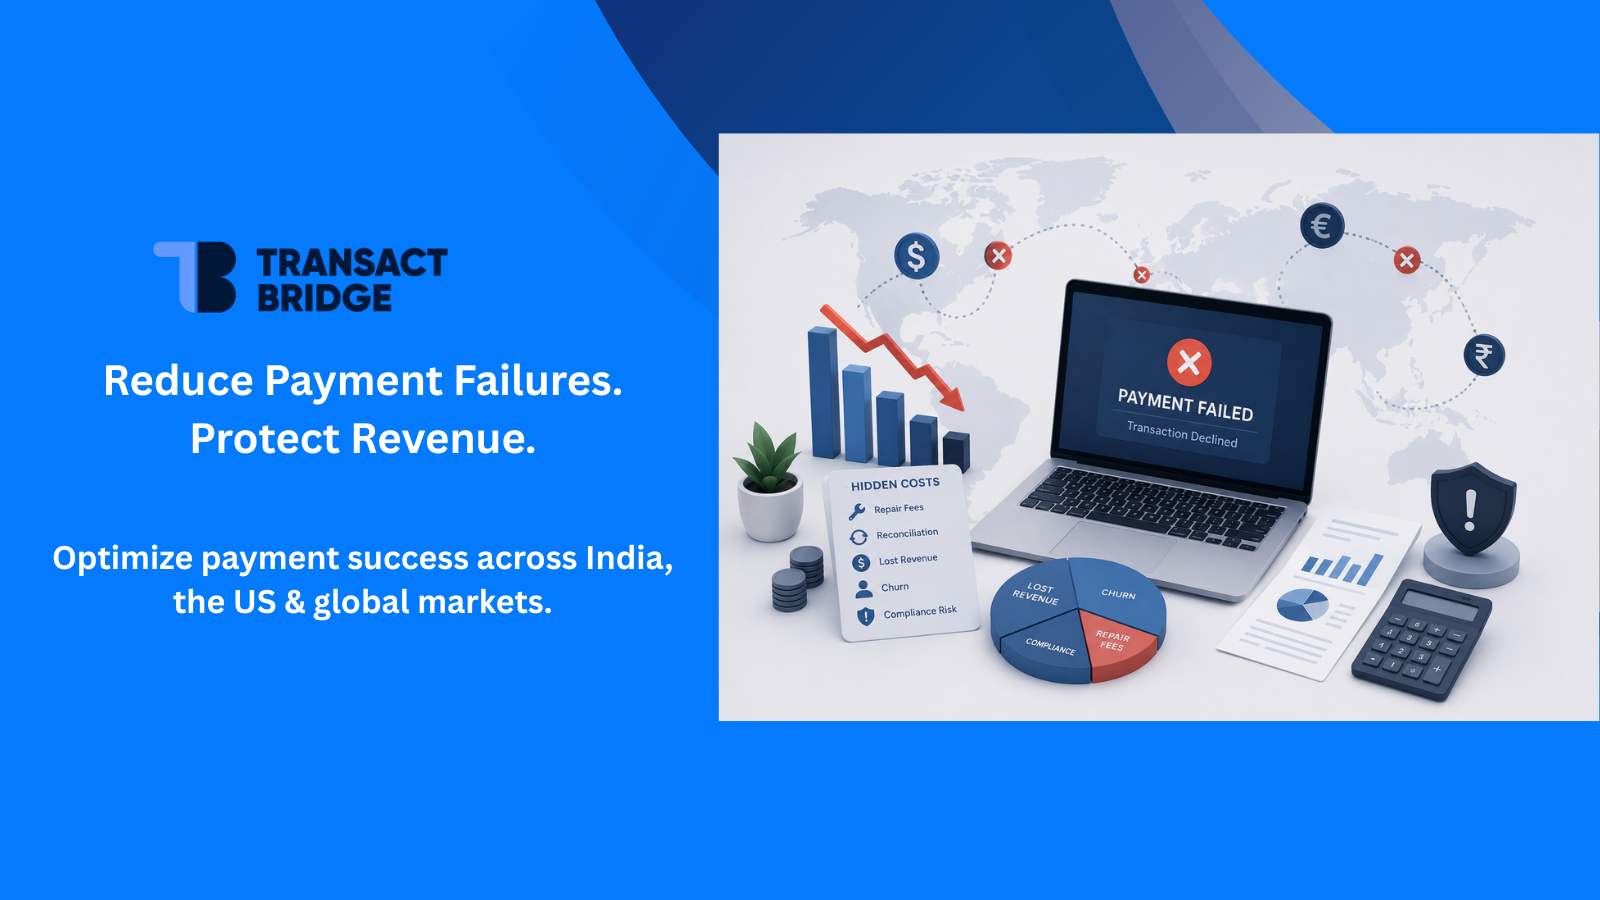
The pattern below makes the point visually: the sticker cost is the smallest, most visible link in a much longer chain.
How the Cost Actually Cascades
Payment Failure
↓
Lost Sale (visible, small)
↓
Support / Reconciliation Cost (labor, hard to isolate)
↓
Customer Trust Erosion (fewer repeat attempts)
↓
LTV Loss (subscription businesses: full remaining lifetime value)
↓
Compliance Exposure (repeated-corridor scrutiny)
↓
Net Profit Impact (the number leadership actually feels, quarters later)
How Much Revenue Is Actually Lost to International Payment Failures?
This is where the picture needs to be market-aware rather than market-led. Failure causes and rates differ by region, but the underlying economics – friction destroys revenue – hold everywhere.
Market | Revenue Impact |
Global | Failed payments continue to cost the global economy an estimated US$118.5 billion annually in fees, labor, customer attrition, and lost business. |
United States | Failed cross-border payments cost US merchants at least $3.8 billion in lost sales in 2023; cross-border-focused merchants see an 11% average failure rate. |
United States | Cross-border card transactions with US-issued cards grew from 1.4 billion transactions ($0.14T) in 2018 to 7.5 billion transactions ($0.47T) in 2022, meaning failure-rate percentages apply to a fast-growing base. |
India | UPI processed roughly 24,162 crore transactions worth ₹314 lakh crore in FY 2025–26, with system-wide technical decline rates falling from 8–10% in 2016 to below 1% by 2025 under NPCI's Circular OC-149 target (technical decline <1%, business decline <5%). |
The takeaway isn't "the US loses more" or "India has solved this" – it's that failure rates are a function of rail design and merchant infrastructure, not geography. India's technical decline rate fell by an order of magnitude over a decade because NPCI set an explicit, published threshold and enforced it.
The US cross-border card volume shows the opposite pressure: exploding transaction volume without a matching drop in the structural reasons cross-border cards get declined (issuer risk scoring, currency mismatch). Global businesses need infrastructure that performs to the best of these benchmarks, everywhere they sell, not infrastructure that performs well in one home market and degrades elsewhere.
The SaaS-Specific Cost: Involuntary Churn
For subscription and recurring-revenue businesses, failed payments create a distinct and larger problem than one-time checkout failures: involuntary churn– customers who didn't choose to leave but lost access because a recurring charge failed and was never recovered.
Industry benchmarking places involuntary churn at 20–40% of total SaaS churn, driven primarily by expired cards, insufficient funds, and issuer-side fraud flags on recurring charges (Recurly benchmark data, cited across SaaS billing industry research, 2025–2026). Unlike voluntary churn, which usually signals a product or pricing problem, involuntary churn is almost entirely a payments-infrastructure problem which makes it one of the few churn categories a business can fix without changing the product at all.
The math matters more than the percentage: a failed recurring payment doesn't cost a business one billing cycle. It costs the remaining lifetime value of that customer, plus the acquisition cost already spent to win them – both of which are much larger than the invoice amount that failed.
How a Failed Recurring Payment Actually Plays Out
Day | What Happens |
Day 0 | Billing runs, the charge is declined, customer is usually unaware |
Day 1–3 | Automated payment-failed notice sent; easy to miss |
Day 3–7 | No response yet; access may be restricted depending on grace-period policy |
Day 7–14 | Follow-up outreach; this window is where most recoverable payments actually get recovered |
Day 14–21 | Recovery odds drop sharply past this point |
Day 21–30 | Subscription typically cancelled; revenue loss is now realized, not pending |
The practical implication: recovery isn't a "some day" task – it's a two-week window. Payment infrastructure that retries intelligently and flags hard declines early (rather than treating every failure the same) is what determines whether a business is operating inside that window or discovering the loss after it's already final.
Back to the Numbers
Go back to the $10M ARR company from the introduction. A 9% payment failure rate sounds manageable on paper until it's translated into dollars: roughly $900,000 in at-risk annual revenue. Even with a well-run recovery process recovering 60% of failures, the business still absorbs ~$360,000 in irrecoverable annual revenue from payment failures alone – before counting the reconciliation time or support load those failures generated.
Their finance lead's instinct was right: it wasn't a growth problem or a pricing problem. It was a payment-infrastructure problem wearing a churn costume. And the lever wasn't "recover more failures", it was reducing the failure rate itself, since every point of authorization-rate improvement compounds directly into fewer failures to recover in the first place.
What's a 9% Failure Rate Costing You?
Run the same math on your own revenue. Transact Bridge can show you exactly where the leak is and what recovering it looks like.
How International Payment Failures Show Up by Industry
Industry | Where Failures Concentrate | Why It Matters |
SaaS / subscription software | Recurring billing declines, card expiry cycles | Directly drives involuntary churn and NRR erosion |
Gaming / game servers | High-frequency micro-transactions across many countries | High transaction volume means even a small decline-rate gap compounds fast |
AI / API-based products | Usage-based billing failures on unfamiliar payment rails in new markets | Failed billing can silently cap usage before anyone notices |
Creator economy platforms | Cross-border payouts and inbound payments, both failure-prone | Failures hit both revenue collection and creator trust/retention simultaneously |
EdTech | High-value one-time or installment payments from price-sensitive, multi-country audiences | A single failed high-ticket payment is a proportionally larger loss than in high-volume, low-ticket models |
Expert Insight: The industries where failure cost hides best are the ones with high transaction volume and low per-transaction value – gaming and creator platforms especially because no single failure is ever big enough to trigger a manual review, so the pattern only becomes visible in aggregate.
What Is a Good Payment Authorization Rate?
There's no single global benchmark, because "good" depends on transaction type and corridor, but there are useful reference points.
- For UPI in India, NPCI's published operational thresholds require member banks to keep technical declines below 1% and business declines below 5% (Circular OC-149, June 2022), implying a blended success-rate ceiling above roughly 94%.
- For cross-border card transactions generally, merchants focused on international sales report an 11% average failure rate, meaning an ~89% authorization rate is closer to the current cross-border norm than the ~95%+ domestic-card benchmark most finance teams mentally default to (PYMNTS Intelligence & Nuvei, 2024).
The gap between those two numbers – a well-run domestic rail approaching 99% and a typical cross-border card flow around 89% – is the single clearest quantified argument for why cross-border payment infrastructure needs to be purpose-built, not a bolt-on to domestic processing.
Global SaaS companies expanding into new corridors often close this gap through local acquiring partnerships rather than trying to optimize a single global processor across every market at once.
Common Mistakes That Make International Payment Failures Worse
- Treating every decline the same. Retrying a hard decline (expired card, closed account) as if it were a soft one wastes recovery cycles and can trigger fraud flags with the issuer.
- Measuring only the failure rate, not the diagnosis rate. Knowing your cross-border failure rate but not why transactions fail is the exact gap PYMNTS found affecting 82% of merchants.
- Using one checkout configuration globally. A card-only checkout in a market where local rails dominate (e.g., UPI in India) isn't a minor UX gap, it's a structural failure source.
- Reporting churn as one number. Blending voluntary and involuntary churn hides the fact that involuntary churn is a fixable infrastructure problem, not a product or pricing problem.
- Treating compliance checks as a one-time setup cost. Beneficiary-verification standards are tightening (e.g., FATF Recommendation 16 updates), and static compliance logic falls out of date.
Best Practices for Reducing International Payment Failures
The fastest way to reduce payment failures – domestically and across borders – is to stop treating every decline the same and start diagnosing before optimizing:
- Separate soft and hard declines in your retry logic, and route each to the correct recovery path instead of a single blanket retry sequence.
- Diagnose before optimizing. Break down failure reasons by corridor and payment method before investing in fixes – an issuer-risk problem and a local-rail problem require entirely different solutions.
- Match checkout to local payment behavior, not just local currency. Adding local rails typically has a larger authorization-rate impact than currency localization alone.
- Track involuntary churn as its own metric, separate from voluntary churn, so recovery investment can be measured against it directly.
- Build (or buy) compliance validation that updates with regulatory changes, rather than a static one-time integration.
- Treat authorization rate as a revenue metric owned by finance and growth, not just a technical metric owned by engineering.
Risk Matrix: Where International Payment Failures Actually Hurt
Risk Type | Likelihood | Financial Impact | Who Usually Owns This Blind Spot |
Lost one-time sale | High | Low (per instance) | Sales/growth |
Involuntary churn (recurring revenue) | Medium–High | High (compounds over LTV) | Finance/RevOps |
Reconciliation & ops overhead | High | Medium (labor cost, hard to isolate) | Operations |
Compliance scrutiny from repeated corridor failures | Low–Medium | High (regulatory/reputational) | Legal/Compliance |
Customer trust erosion affecting future conversion | Medium | Medium–High (hard to quantify, real) | Marketing/Growth |
Worth noting: the risks with the highest financial impact (churn, compliance) are also the ones least likely to sit under a single team's ownership which is often the real reason they go unmanaged, not lack of awareness.
Should You Fix This Internally, Use Local Acquiring, or Use a Merchant of Record?
This is the practical decision most growth-stage businesses eventually face once they've quantified their failure cost. There's no universally right answer, but there is a reliable way to think through it:
- Fix it internally if: you're processing in one or two markets, your engineering team has spare capacity, and your failure rate is already reasonably close to benchmark. Build smart retry logic and decline-code monitoring yourself.
- Add local acquiring if: your failures concentrate in specific corridors due to issuer risk scoring, but your compliance and tax obligations are still manageable in-house. This targets the authorization-rate problem specifically without changing your legal/compliance structure.
- Move to a Merchant of Record if: you're selling across three or more markets, compliance overhead is growing faster than your team can absorb, and payment failures, tax complexity, and beneficiary-verification requirements are compounding at the same time. An MoR addresses authorization, compliance, and settlement risk together, rather than one at a time.
- The pattern: the more markets and the more compliance surface area involved, the more the "internal fix" option costs in opportunity cost, even when it looks cheapest on a vendor invoice.
Payment Gateway vs. Merchant of Record
Payment Gateway | Merchant of Record | |
Who is legally the seller | The business itself | The MoR, on the business's behalf |
Tax/compliance responsibility | Business | MoR |
Payment routing/authorization optimization | Often limited to the gateway's default logic | Actively managed across corridors |
Beneficiary/compliance verification | Business builds and maintains this | Handled by the MoR, updated with regulatory change |
Best fit | Single-market or low-complexity multi-market businesses | Businesses selling across multiple markets with real compliance surface area |
Already Outgrowing Your Payment Gateway?
If compliance and authorization optimization are starting to feel like a second job, it might be time to hand it to an MoR built for exactly that.
How Does a Merchant of Record Improve Payment Success?
A Merchant of Record (MoR) sits legally and operationally between the business and the payment rails, taking on responsibility for tax compliance, local regulatory requirements, and critically for this topic, payment routing and authorization optimization across markets. This matters directly for the failure modes covered above:
Local acquiring reduces the issuer risk-scoring problem: a transaction that looks "local" to the issuing bank is authorized at a materially higher rate than one that looks foreign, even when the underlying purchase is identical.
Compliance automation addresses the beneficiary-mismatch and jurisdiction-specific declines that account for a large share of cross-border failures. The MoR absorbs the regulatory validation work instead of leaving it to manual bank-side checks.
Unified routing across corridors means a business selling in India, the US, and other global markets isn't stitching together separate integrations with separate failure profiles. It's operating on infrastructure built to perform consistently across all of them.
Transact Bridge operates as a Merchant of Record and payment platform built for exactly this cross-border reality – payments across India, the US, and global markets on one infrastructure layer, rather than a patchwork of region-specific processors.
That's the direct link between "why payments fail" and what fixing it actually requires: infrastructure designed for multiple corridors from the start, not a domestic gateway with international features added on.
Is Your Business Losing Revenue to International Payment Failures? A Quick Readiness Check
- You can name your cross-border authorization rate by corridor, not just in aggregate
- You separate soft declines from hard declines in your retry logic
- You track involuntary churn as a distinct metric from voluntary churn
- Your checkout offers locally relevant payment methods in each major market you sell into
- You know what percentage of failures your team can currently diagnose the root cause of
- Your compliance/beneficiary-verification logic has been updated in the last 12 months
Checking fewer than four of these usually means there's recoverable revenue sitting in the "failed payment" line that hasn't been quantified yet.
Checked Fewer Than Four? Let's Fix That.
Talk to Transact Bridge about closing the gaps in your cross-border payment infrastructure – before they show up as churn.
The Bottom Line
International payment failures are never just one lost sale. Each one is a repair fee, a chunk of someone's analyst-week spent diagnosing the cause, a customer who quietly doesn't come back, and increasingly a compliance data point regulators are starting to watch. Businesses that treat authorization rate as a core revenue metric, not a technical afterthought, are the ones who stop losing money to a problem their dashboard never shows them directly.
FAQs
Why do international payments fail more often than domestic ones?
Transact Bridge sees this pattern consistently across markets: issuers apply stricter fraud scoring to cross-border transactions by default, currency mismatches trigger additional authentication requirements, and local payment-rail incompatibilities and compliance checks add friction that domestic transactions don't encounter.
What's the average cost of failed international payments?
Beyond the lost sale itself, Transact Bridge's research points to industry data showing the average fee for a rejected or repaired cross-border payment runs around $12 before accounting for reconciliation labor, customer churn, or compliance follow-up (LexisNexis Risk Solutions data).
Does a higher authorization rate actually move revenue, or just reduce friction?
Transact Bridge treats this as a revenue question, not just an operations one: it moves revenue directly. Since cross-border failure rates run around 11% versus a much lower domestic baseline, closing even a few points of that gap recovers real transaction volume not just a better-looking dashboard metric.
Can failed payments hurt compliance standing, not just revenue?
Transact Bridge's compliance approach exists precisely because the answer is yes, in some cases. Repeated failures tied to incomplete beneficiary data can draw additional scrutiny under tightening standards like FATF's beneficiary-matching requirements, particularly for businesses processing high volumes across multiple jurisdictions.
Is a Merchant of Record the same as a payment gateway?
Transact Bridge operates as a Merchant of Record, not a gateway, and the distinction matters: the two solve different problems. See the comparison above for how they differ on compliance, routing, and legal responsibility.