EBIT for Cross-Border Payments: How to Calculate EBIT for International Businesses
Published on: Fri 26-Jun-2026 03:34 PM
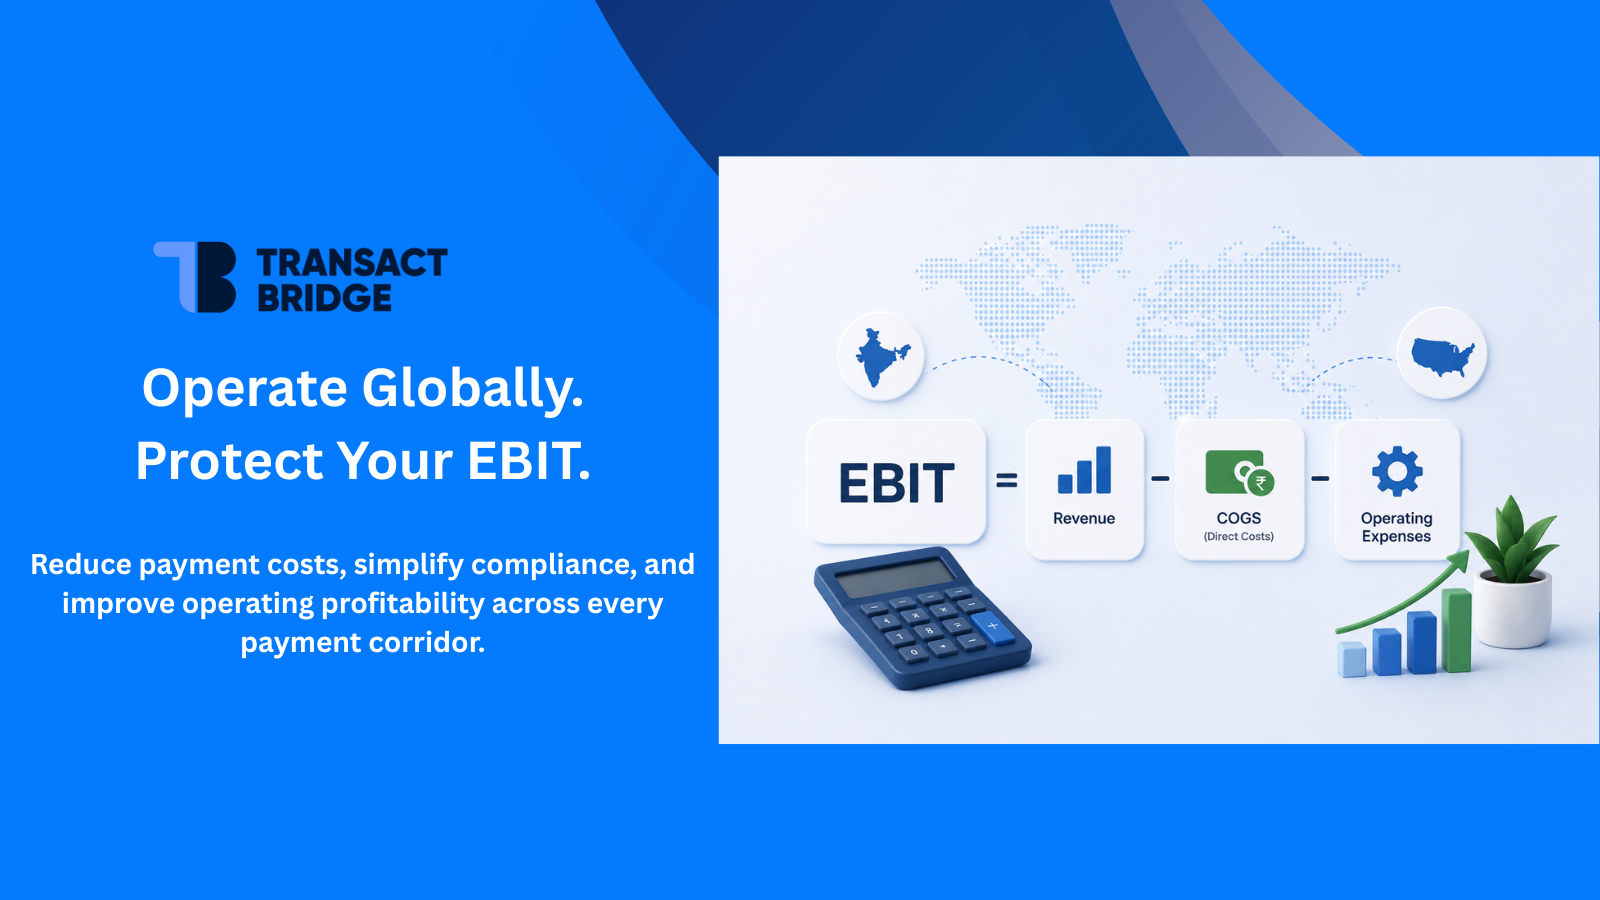
Quick Answer
EBIT (Earnings Before Interest and Taxes) is a measure of a company's operating profit before interest expenses and income taxes. It shows how profitably a business generates earnings from its core operations, independent of financing decisions and tax obligations.
Formula
EBIT = Net Income + Interest + Taxes
or
EBIT = Revenue − Cost of Goods Sold (COGS) − Operating Expenses
Why It Matters
EBIT provides a clear view of operational performance by removing the effects of debt and tax structures. For businesses operating across India, the US, and global markets, it enables meaningful profitability comparisons across jurisdictions and helps evaluate the strength of the underlying business.
The Moment It All Made Sense
Understanding EBIT for cross-border payments starts with knowing how to calculate EBIT for an international business. While the formula itself is straightforward, operating across multiple countries introduces foreign exchange costs, payment infrastructure expenses, compliance requirements, and tax differences that directly affect operating profit.
During a meeting with a US investor, a SaaS founder from Bengaluru was asked a simple question:
"What's your EBIT margin?"
She knew her revenue and net profit but didn't have the interest expense and tax figures needed to calculate EBIT. After the meeting, she asked her CFO why the investor focused on EBIT instead of net profit.
The answer was straightforward:
"Net profit reflects the impact of financing and taxes. EBIT shows whether the business itself is profitable before those factors come into play."
That's why investors, lenders, and boards rely on EBIT. It provides a consistent way to compare operating performance across companies, regardless of their debt levels or tax jurisdictions. For businesses operating across India, the US, and global markets, where financing costs, tax regimes, and compliance expenses vary significantly, EBIT offers one of the clearest measures of operational profitability.
Not sure how your EBIT stacks up? Calculate your cross-border payment margin free →
EBIT at a Glance
Aspect | Summary |
Purpose | Measures operating profitability before interest expenses and income taxes. |
Used By | Investors, lenders, boards, finance teams, analysts, and business owners. |
Best For | Comparing operational performance across companies with different financing structures and tax jurisdictions. |
Not Used For | Measuring final earnings available to shareholders or cash flow. |
The EBIT Formula : Two Methods Explained
There are two standard approaches to calculating EBIT. Both produce the same result. Which one you use depends on where you are starting in your income statement.
Method 1 : Bottom-up (starting from Net Income)
If you already have a finalized income statement:
EBIT = Net Income + Interest Expense + Tax Expense
Method 2 : Top-down (starting from Revenue)
If you want to build EBIT from scratch and understand where profitability is created:
EBIT = Revenue − Cost of Goods Sold (COGS) − Operating Expenses
Which simplifies to:
EBIT = Gross Profit − Operating Expenses
Common Mistake When Calculating EBIT
A common misconception is calculating EBIT as:
Revenue − Expenses − Interest − Taxes
This is not EBIT. It is Net Income.
Remember:
- EBIT excludes interest and income taxes to measure operating profitability.
- Net Income includes all expenses, including interest and taxes, to show the company's final profit.
If you're starting from revenue, subtract only COGS and operating expenses. If you're starting from net income, add back interest and taxes to arrive at EBIT.
Which method should a payment company use?
Method 2 is more revealing for payment businesses. It separates gross margin- how efficiently you process payments and manage infrastructure costs, from operating expenses- how efficiently you run the company. This distinction matters because in payments, gross margin erosion from FX fees, gateway costs, and correspondent charges is the most common EBIT killer, and it is invisible in the bottom-up method until it is too late.
How to Calculate EBIT for International Businesses (Step-by-Step Guide)
The clearest way to understand EBIT for cross-border payments is through a real payments business example. The model below shows how to calculate EBIT for a company processing transactions across the India–US corridor.
Model: India-US Corridor Payment Business : Annual Financials
Line Item | Amount | % of Revenue |
Total Revenue (take rate on GPV) | ₹100 Cr | 100% |
FX costs + partner settlement fees (COGS) | ₹60 Cr | 60% |
Gross Profit | ₹40 Cr | 40% |
Technology and infrastructure | ₹4 Cr | 4% |
Compliance and regulatory | ₹3 Cr | 3% |
Sales and marketing | ₹2 Cr | 2% |
General and administrative | ₹1 Cr | 1% |
Total Operating Expenses | ₹10 Cr | 10% |
EBIT | ₹30 Cr | 30% |
Interest expense (working capital loan) | ₹5 Cr | 5% |
Profit Before Tax | ₹25 Cr | 25% |
Income Tax (25%) | ₹5 Cr | 5% |
Net Income | ₹20 Cr | 20% |
Verification using Method 1: EBIT = ₹20 Cr + ₹5 Cr + ₹5 Cr = ₹30 Cr ✓
Verification using Method 2: EBIT = ₹40 Cr − ₹10 Cr = ₹30 Cr ✓
EBIT Margin = ₹30 Cr ÷ ₹100 Cr = 30%
This 30% EBIT margin is a strong result. Section 9 covers whether it is realistic and how it compares to industry benchmarks.
Also notice the interest coverage ratio here: EBIT ÷ Interest Expense = ₹30 Cr ÷ ₹5 Cr = 6x. Lenders consider anything above 3x as financially healthy. At 6x, this business would have no difficulty accessing additional credit.
See how your corridor compares. Run your own EBIT model with TransactBridge →
EBIT Calculation Examples Across Different Businesses
EBIT is calculated the same way across industries, but the underlying costs differ. Here are a few simplified examples.
Example 1: SaaS Company
A SaaS business generates ₹12 crore in annual subscription revenue.
- Revenue: ₹12 Cr
- Cost of Service (cloud hosting, customer support): ₹3 Cr
- Operating Expenses (R&D, sales, marketing, admin): ₹5 Cr
EBIT = ₹12 Cr − ₹3 Cr − ₹5 Cr = ₹4 Cr
EBIT Margin = 33.3%
- Example 2: EBIT Calculation for Indian Exporters
An Indian manufacturer exports products to the US and Europe.
- Revenue: ₹50 Cr
- Cost of Goods Sold: ₹32 Cr
- Operating Expenses (logistics, warehousing, salaries): ₹8 Cr
EBIT = ₹50 Cr − ₹32 Cr − ₹8 Cr = ₹10 Cr
EBIT Margin = 20%
- Example 3: International Business
A digital business sells in India, the US, and Europe through multiple payment providers.
- Revenue: ₹80 Cr
- Cost of Service (payment processing, FX, delivery costs): ₹42 Cr
- Operating Expenses: ₹18 Cr
EBIT = ₹80 Cr − ₹42 Cr − ₹18 Cr = ₹20 Cr
EBIT Margin = 25%
Although each business has different cost structures, EBIT always measures the same thing: the profitability of core operations before interest expenses and income taxes.
EBIT vs EBITDA for SaaS Companies in India and Payment Businesses
EBITDA simply takes EBIT one step further by adding back depreciation and amortization:
EBITDA = EBIT + Depreciation + Amortization
EBIT | EBITDA | |
|---|---|---|
Excludes interest? | Yes | Yes |
Excludes taxes? | Yes | Yes |
Excludes depreciation? | No | Yes |
Best measures | Operational profitability | Cash-generation ability |
Primary use | Performance comparison, credit analysis | M&A, investor due diligence |
Valuation multiple | EV/EBIT | EV/EBITDA |
When should a payment company use each?
Use EBIT when comparing operational performance quarter over quarter, demonstrating debt serviceability to a lender, or analysing whether a specific payment corridor is profitable on its own.
Use EBITDA when preparing for a fundraise or M&A process, or when your company carries significant fixed infrastructure, licensed payment software being amortized, proprietary hardware, that generates large depreciation charges. As RBI payment aggregator requirements push more companies to invest in owned compliance infrastructure, the gap between EBIT and EBITDA for India-licensed payment businesses will widen.
For most early and mid-stage payment fintech's operating on cloud infrastructure, EBIT and EBITDA are close to each other. The rule of thumb: EBIT tells you how good your business is at its job. EBITDA tells you how much cash it throws off.
Quick Decision Guide: Should You Use EBIT or EBITDA?
Use EBIT if you want to:
- Compare operating performance across reporting periods.
- Evaluate profitability before financing and tax decisions.
- Assess the performance of a payment corridor, product line, or business unit.
- Demonstrate operating profitability to lenders, investors, or your board.
Use EBITDA if you want to:
- Assess cash-generating potential before non-cash expenses.
- Compare companies with different depreciation or amortization policies.
- Prepare for fundraising, mergers, acquisitions, or valuation discussions.
- Analyse businesses with significant investments in infrastructure or long-term assets.
Operating Profit vs EBIT Explained (Operating Income vs Net Profit)
These three terms are frequently used interchangeably. They should not be.
Metric | Definition | Excludes |
Gross Profit | Revenue − COGS | Operating expenses, interest, tax |
Operating Income | Gross Profit − Operating Expenses | Some non-recurring items, interest, tax |
EBIT | Operating Income ± non-recurring adjustments | Interest and tax only |
Profit Before Tax | EBIT − Interest | Tax only |
Net Profit | PBT − Tax | Nothing |
The subtle difference between EBIT and operating income lies in one-off items. A reported operating income figure may exclude a regulatory penalty, a currency hedge loss, or a one-time infrastructure write-down. EBIT typically adds these back to reflect true recurring operational performance.
For Indian payment companies navigating new RBI compliance requirements, one-off remediation expenses are increasingly common, making this distinction more than academic.
For most payment businesses, the two figures will be identical. But when something extraordinary has happened, EBIT is the more reliable number.
Why EBIT is Important : Four Real Contexts
EBIT is used by founders to measure operational profitability, CFOs to monitor financial performance, investors and private equity firms to compare businesses, lenders to assess debt repayment capacity, and boards to evaluate long-term financial health. The sections below explain these use cases in more detail.
Investor and M&A analysis
When a strategic buyer or financial investor evaluates a payments company, they are not primarily interested in net profit. Net profit reflects how the current owners have structured taxes and financing, not the business's intrinsic earning power. EBIT removes that noise and makes companies with different capital structures and tax jurisdictions directly comparable. The EV/EBIT multiple (Enterprise Value ÷ EBIT) is one of the most common valuation metrics used to assess payment companies.
Creditworthiness
Banks and NBFCs offering working capital lines to payment businesses closely monitor EBIT because it represents pre-tax, pre-interest cash generation available to service debt. The interest coverage ratio (EBIT ÷ Interest Expense) is a standard credit metric. Below 2x raises concern. Above 3x is healthy. Above 5x is strong and supports access to working capital credit at better rates.
Operating efficiency monitoring
EBIT margin trends over time reveal whether a business is scaling efficiently. If revenue grows 40% year-over-year but EBIT grows only 12%, operating expenses are outpacing revenue growth, a clear warning that the cost structure is not leveraging properly. This is where corridor-level EBIT analysis, covered in Section 7, becomes especially valuable.
Industry benchmarking
If EBIT margin falls across an entire sector simultaneously as it did for Indian payment companies when RBI compliance costs surged in 2024–25, a company's declining margin may be a sector headwind, not a management failure. EBIT analysis makes this distinction visible and defensible to investors and board members.
EBIT in Cross-Border Payments: The Hidden Margin Killers
EBIT for cross-border payments is influenced by cost drivers that most other industries never face. Unlike traditional businesses, payment providers must manage foreign exchange costs, settlement infrastructure, regulatory compliance, and liquidity management alongside normal operating expenses.
The four cost categories below have the greatest influence on EBIT for cross-border payment businesses. Understanding and controlling them is often the difference between a healthy operating margin and a business that struggles to scale.
The global cross-border payments market is projected to exceed USD 727 billion by 2034, making operational efficiency a critical competitive advantage rather than just a financial metric.
EBIT Killer 1: FX conversion fees
FX conversion fees reduce EBIT because they directly lower gross margin before the business can recover operating costs. Every additional basis point paid in foreign exchange spreads leaves less operating profit available, making FX one of the largest controllable cost drivers for payment businesses. Industry estimates place average FX conversion costs at approximately 2.5–3% of transaction value.
EBIT Killer 2: Correspondent banking charges
Traditional SWIFT-based transfers carry combined correspondent and beneficiary bank fees that often total USD 25–45 per transaction. For low-value B2B payments, common in India-US trade flows for services, freelancing, and digital exports, these fixed fees can consume the entire margin on a transaction. Modern payment rails like the UPI-PayNow corridor, which processed USD 1.2 billion in 2025, compress these costs dramatically.
EBIT Killer 3: Compliance operating expenditure
Compliance costs have shifted from being occasional project expenses to recurring operating costs. Regulatory requirements such as merchant onboarding, cybersecurity, governance, and ongoing reporting all sit within operating expenses, reducing EBIT regardless of transaction volume. For payment businesses, improving compliance efficiency is now as important as reducing technology costs.
Mid-sized payment aggregators may spend several crores annually on compliance infrastructure.
EBIT Killer 4: Settlement float costs
Settlement float ties up capital that could otherwise be deployed for growth. While these financing costs do not reduce EBIT directly, they increase interest expenses below the EBIT line and reduce overall profitability. Businesses that shorten settlement cycles or reduce pre-funding requirements improve both capital efficiency and financial flexibility.
The global industry estimates USD 120 billion in annual opportunity costs from settlement float. For a business pre-funding a USD 2 million nostro position at 5% annualised cost, that is USD 100,000 hitting the interest expense line, reducing profit before tax even after EBIT is calculated cleanly.
These four cost drivers may be silently eroding your margin. Talk to a TransactBridge specialist →
EBIT Formula Example for US-India Trade Corridor
The following example shows how these cost drivers affect EBIT in a typical US–India cross-border payment corridor.
What a realistic corridor P&L looks like:
Line Item | Amount | % of Revenue |
Gross Payment Volume processed | USD 50M | — |
Net Revenue (take rate 1.2%) | USD 600,000 | 100% |
FX and partner settlement fees | USD 240,000 | 40% |
Gross Profit | USD 360,000 | 60% |
Technology and infrastructure | USD 90,000 | 15% |
Compliance and regulatory | USD 60,000 | 10% |
Sales and marketing | USD 45,000 | 7.5% |
General and administrative | USD 30,000 | 5% |
Total Operating Expenses | USD 225,000 | 37.5% |
EBIT | USD 135,000 | 22.5% |
A 22.5% EBIT margin on this model is achievable at scale with modern rail infrastructure and lean operations. Getting there requires controlling the FX and settlement cost line relentlessly because that single line accounts for 40% of revenue and is the primary lever on EBIT.
RBI 2025 : How India's New Payment Aggregator Rules Are Reshaping EBIT
On September 15, 2025, the RBI issued its Master Direction on Regulation of Payment Aggregators, 2025. This consolidated framework replaces all previous guidelines and creates a single compliance regime across three categories: PA-Online, PA-Physical, and PA-Cross Border (PA-CB).
The financial implications for EBIT are significant and immediate.
Net worth requirements create a capital drag. Non-bank payment aggregators must demonstrate a minimum net worth of ₹15 crore at the time of RBI authorisation, rising to ₹25 crore by the end of the third financial year. Capital locked into meeting net worth thresholds cannot be deployed operationally. It constrains the working capital available to pre-fund payment corridors and reduces return on equity.
Compliance costs are now non-negotiable operating expenses. Mandatory CERT-In cybersecurity audits, board-level risk committees, full AML/KYC merchant onboarding, escrow account frameworks, and ongoing transaction monitoring are all required and recur annually. For sub-scale payment aggregators processing under ₹500 crore annually, these fixed compliance costs can represent 4–6% of revenue, enough to turn an otherwise viable EBIT margin negative.
The cross-border PA category adds a FEMA layer. Cross-border payment aggregators face additional compliance requirements under FEMA alongside RBI's PA-CB framework, including transaction limits of ₹25 lakh and mandatory routing through authorised dealer banks. Each additional compliance layer adds overhead that sits directly in EBIT-reducing operating expenses.
The consolidation effect. The RBI's framework is explicitly designed to crowd out undercapitalised players. Entities that cannot meet the ₹25 crore net worth threshold within three years will effectively be forced to exit or be acquired. For well-capitalised payment businesses already operating with regulatory infrastructure in place, this consolidation creates opportunity as competitors with thinner EBIT margins exit the market.
The practical conclusion: in 2026 and beyond, EBIT margin in Indian payment businesses is increasingly a function of compliance efficiency not just commercial efficiency. The companies that build compliance infrastructure into their product architecture, rather than bolting it on reactively, will carry structurally lower operating expenses and therefore structurally higher EBIT margins.
EBIT Margin Benchmarks by Industry
There is no single "good" EBIT margin. The right benchmark depends on the industry's cost structure, pricing model, operating leverage, and regulatory requirements. A software company, an exporter, and a cross-border payment provider all incur different operating costs, so comparing their EBIT margins directly can be misleading.
The table below provides indicative EBIT or EBITDA benchmarks across several industries.
Industry / Company | Typical EBIT / EBITDA Margin | Why It Differs |
Early-stage SaaS company | 5–15% EBIT | High investment in product development, sales, and customer acquisition. |
Mature SaaS company | 20–35% EBIT | Strong recurring revenue and high operating leverage. |
Subscription-based digital business (OTT, Memberships, AI) | 15–30% EBIT | Depends on subscriber retention, content or infrastructure costs, and payment efficiency. |
Indian exporter | 8–18% EBIT | Margins are influenced by production costs, logistics, foreign exchange, and global demand. |
Early-stage payment fintech | 5–15% EBIT | Significant investment in technology, compliance, and customer acquisition. |
Scaled B2B cross-border payment company | 18–28% EBIT | Efficient payment infrastructure, disciplined pricing, and mature compliance processes. |
Enterprise payment processor | 20–30% EBITDA | Benefits from scale, transaction volume, and diversified revenue streams. |
Adyen | ~45% EBITDA | Full-stack global payment platform with significant operating leverage. |
Wise | ~20% EBIT (target) | Cross-border payment specialist focused on operational efficiency. |
Nuvei | ~28% EBITDA | Global payment processor serving enterprise merchants. |
Zaggle (India) | ~9.6% EBITDA | India-listed fintech operating in a high-growth investment phase. |
What These Benchmarks Tell You
Three insights emerge from these benchmarks.
1. Industry matters more than absolute numbers.
A 15% EBIT margin may be considered excellent for an exporter operating with thin product margins, while it could indicate room for improvement for a mature SaaS company. Always compare your business with companies that share a similar operating model.
2. Scale improves operating profitability but only with efficient operations.
As businesses grow, fixed costs such as technology platforms, compliance teams, and administrative functions are spread across larger revenue bases. Companies that combine scale with disciplined cost management typically achieve higher EBIT margins.
3. Payment businesses face unique operating cost pressures.
Unlike many software businesses, cross-border payment companies absorb costs related to foreign exchange, settlement infrastructure, regulatory compliance, and payment operations. Managing these cost drivers effectively is often the biggest determinant of long-term EBIT performance.
A Note on Benchmarking
Public companies such as Visa and Mastercard are often referenced in profitability discussions, but they are not ideal EBIT benchmarks for payment processors or payment aggregators. Their business models, economics, and infrastructure ownership differ significantly from companies that process, settle, and manage cross-border payments. For a meaningful comparison, benchmark against businesses with similar products, operating models, and regulatory obligations.
How Payment Gateway Costs Silently Destroy Your EBIT : A Walkthrough
This section answers the question we hear most often from payment business finance leaders: "Our revenue is growing, why is our EBIT not keeping up?"
The answer almost always lives in the COGS line.
Understanding how to improve EBIT in B2B payments starts here, not in the operating expense line, but in the cost of processing itself.
Scenario A : Legacy gateway infrastructure
- Gross Payment Volume: USD 10 million per month
- Take rate: 1.5% → Revenue: USD 150,000
- Gateway cost: 0.7% + USD 0.25 per transaction (50,000 transactions) → Cost: USD 82,500
- Gross Profit: USD 67,500 → Gross Margin: 45%
- Operating Expenses: USD 50,000
- EBIT: USD 17,500 → EBIT Margin: 11.7%
Scenario B : Modern rail infrastructure (same volume, same pricing)
- Gross Payment Volume: USD 10 million per month
- Take rate: 1.5% → Revenue: USD 150,000
- Gateway cost: 0.45% flat → Cost: USD 45,000
- Gross Profit: USD 105,000 → Gross Margin: 70%
- Operating Expenses: USD 50,000 (identical)
- EBIT: USD 55,000 → EBIT Margin: 36.7%
Same volume. Same pricing to the customer. Same operational team. One difference: the infrastructure cost structure.
EBIT goes from USD 17,500 to USD 55,000 a 214% increase purely from changing the cost of processing. Over 12 months, that difference compounds to USD 450,000 in additional EBIT on a single USD 10M/month volume business.
This is the fundamental commercial argument for choosing payment infrastructure partners on the basis of total cost to EBIT, not just quoted headline rates.
Your infrastructure choice is your EBIT choice. Switch to modern rails with TransactBridge →
Limitations of EBIT
EBIT is powerful but imperfect. Using it without understanding its limits leads to wrong conclusions.
It ignores debt load entirely. Two companies with identical EBIT figures can be in completely different financial health if one carries significant debt and the other none. An interest coverage ratio below 2x alongside a healthy-looking EBIT is a red flag EBIT alone would not surface.
It includes depreciation, unlike EBITDA. For payment companies with significant owned infrastructure, licensed technology, proprietary hardware, data centre assets, depreciation charges may be material. In these cases EBIT understates cash-generating ability.
It is not a standardised metric. Different companies calculate EBIT differently. Some add back one-off items, some do not. Cross-company comparisons without understanding the methodology are unreliable.
It does not capture working capital realities. A cross-border payment business can report strong EBIT while struggling with payroll if pre-funding requirements trap cash in nostro accounts or if settlement cycles run long. EBIT profit on paper and actual cash availability can diverge significantly in payments.
It can mask compliance risk and this is where compliance architecture matters. A payment business running a lean compliance function may report healthy EBIT until an RBI audit triggers a mandatory remediation programme.
The future compliance cost is invisible in today's EBIT. This is precisely why compliance architecture matters more than compliance spend as a line item: a business that has embedded compliant infrastructure pays a known, fixed cost. A business that has deferred compliance pays an unpredictable and potentially existential one.
How TransactBridge Protects Your EBIT Margin
Every basis point of EBIT in a payment business is fought for on both the revenue and cost sides simultaneously. The three biggest structural drags on EBIT for India-US payment businesses are infrastructure cost, compliance overhead, and settlement float. The example below shows how infrastructure and compliance choices affect each line using a real corridor model as the basis.
Improving EBIT for cross-border payments requires more than increasing revenue. It depends on reducing infrastructure costs, simplifying compliance, and improving settlement efficiency across every payment corridor.
Infrastructure cost reduction
A B2B payment business processing USD 10 million per month across the India-US corridor through a traditional correspondent banking model typically carries gateway and settlement costs of 0.65–0.80% of volume: USD 65,000–80,000 per month in COGS. Routing the same volume through TransactBridge's direct rail integrations with India's UPI ecosystem and US real-time payment infrastructure reduces that cost to approximately 0.40–0.50%, USD 40,000–50,000 per month. That difference, USD 15,000–30,000 per month in recovered gross margin, falls directly to EBIT.
Compliance overhead elimination
TransactBridge operates with RBI authorisation and built-in AML/KYC infrastructure already certified under the 2025 Master Direction framework. For payment businesses routing transactions through TransactBridge, the recurring compliance overhead- cybersecurity audits, merchant monitoring, escrow management - is embedded in the platform rather than carried as a separate P&L line. This converts compliance from an unpredictable operating expense into a known, fixed cost already accounted for in TransactBridge's pricing.
- Settlement float recovery
TransactBridge's real-time settlement infrastructure across the India-US corridor eliminates the need for large pre-funded nostro positions for most transaction types. For a business that previously pre-funded USD 2 million at 5% annual cost, moving to real-time settlement recovers USD 100,000 per year, directly improving profit before tax.
The combined impact, shown explicitly:
A payment business processing USD 10M/month on legacy infrastructure, with a 11.7% EBIT margin (as shown in Section 10), would see the following shift on TransactBridge:
- Infrastructure cost reduction: +USD 37,500/month to gross profit
- Compliance overhead absorbed into platform: approximately +USD 5,000/month in recovered operating expense
- Settlement float recovery: +USD 8,300/month equivalent
New monthly EBIT: approximately USD 67,800 → EBIT Margin: ~45%
The Bottom Line
EBIT for cross-border payments is far more than an accounting metric. For businesses operating across multiple countries, it provides one of the clearest measures of operational profitability before financing and tax decisions come into play.
The Bengaluru founder who paused on that investor call did not freeze because EBIT is complicated. She froze because no one had translated EBIT into the language of her actual business: payment corridors, gateway costs, compliance spend, and settlement float.
You now have that translation.
Calculate your EBIT. Break it down by corridor. Understand what is building it and what is silently eroding it. And if the numbers point to infrastructure and compliance costs as the primary drag that is precisely the problem TransactBridge exists to solve.
Book a free corridor EBIT review → we'll show you exactly where margin is leaking and what recovering it looks like in numbers.
EBIT FAQs
What is EBIT in simple terms?
Think of EBIT as the profit your business earns from its day-to-day operations before paying lenders and governments. It helps investors, lenders, and management evaluate how efficiently the business itself generates profit.
What is the EBIT formula?
EBIT can be calculated in two ways:
EBIT = Net Income + Interest + Taxes
or
EBIT = Revenue − COGS − Operating Expenses
Both methods produce the same result.
Can you give an EBIT formula example?
A business generates ₹100 crore in revenue, incurs ₹60 crore in COGS and ₹10 crore in operating expenses.
EBIT = ₹100 Cr − ₹60 Cr − ₹10 Cr = ₹30 Cr
Its EBIT margin is 30%.
Does EBIT include depreciation?
Yes. EBIT includes depreciation and amortization because both are operating expenses. EBITDA excludes them.
Is EBIT the same as operating profit?
Not always. Operating profit and EBIT are often identical, but EBIT may include adjustments for certain non-recurring operating items depending on reporting standards.
Can EBIT be negative?
Yes. A negative EBIT means operating expenses exceed gross profit before interest and taxes are considered. It indicates the core business is not yet profitable.
What is the difference between EBIT and EBITDA?
EBIT includes depreciation and amortization, while EBITDA excludes both. EBIT measures operating profitability, whereas EBITDA is commonly used to assess operating cash generation before non-cash expenses.
Should SaaS companies use EBIT or EBITDA?
Both metrics are useful. EBIT is better for measuring operating profitability and efficiency, while EBITDA is often preferred for fundraising, valuation, and comparing SaaS companies with different depreciation or amortization policies.
What is a good EBIT margin?
A good EBIT margin varies by industry. Mature SaaS companies often target 20–35%, subscription businesses 15–30%, exporters 8–18%, and scaled B2B cross-border payment companies typically achieve 18–28%.
Why is EBIT important for international businesses?
EBIT for cross-border payments helps businesses understand how efficiently their international payment operations generate operating profit before interest and taxes. EBIT removes the effects of financing and tax structures, making it easier to compare profitability across businesses operating in different countries. It is particularly valuable for companies expanding across India, the US, and global markets, where tax regimes and compliance costs differ significantly.
How does EBIT affect cross-border payment decisions?
EBIT directly shapes which payment corridors a business can afford to operate, which infrastructure partners make commercial sense, and at what volume a corridor becomes self-sustaining. A corridor with strong revenue but high gateway and FX costs may show negative EBIT making it a cash drain regardless of top-line growth. Tracking EBIT by corridor turns payment decisions into financially grounded choices rather than operational guesses.